Solve Problems Using Venn Diagram
Visualize set relationships for 2, 3, or 4 circles in real-time
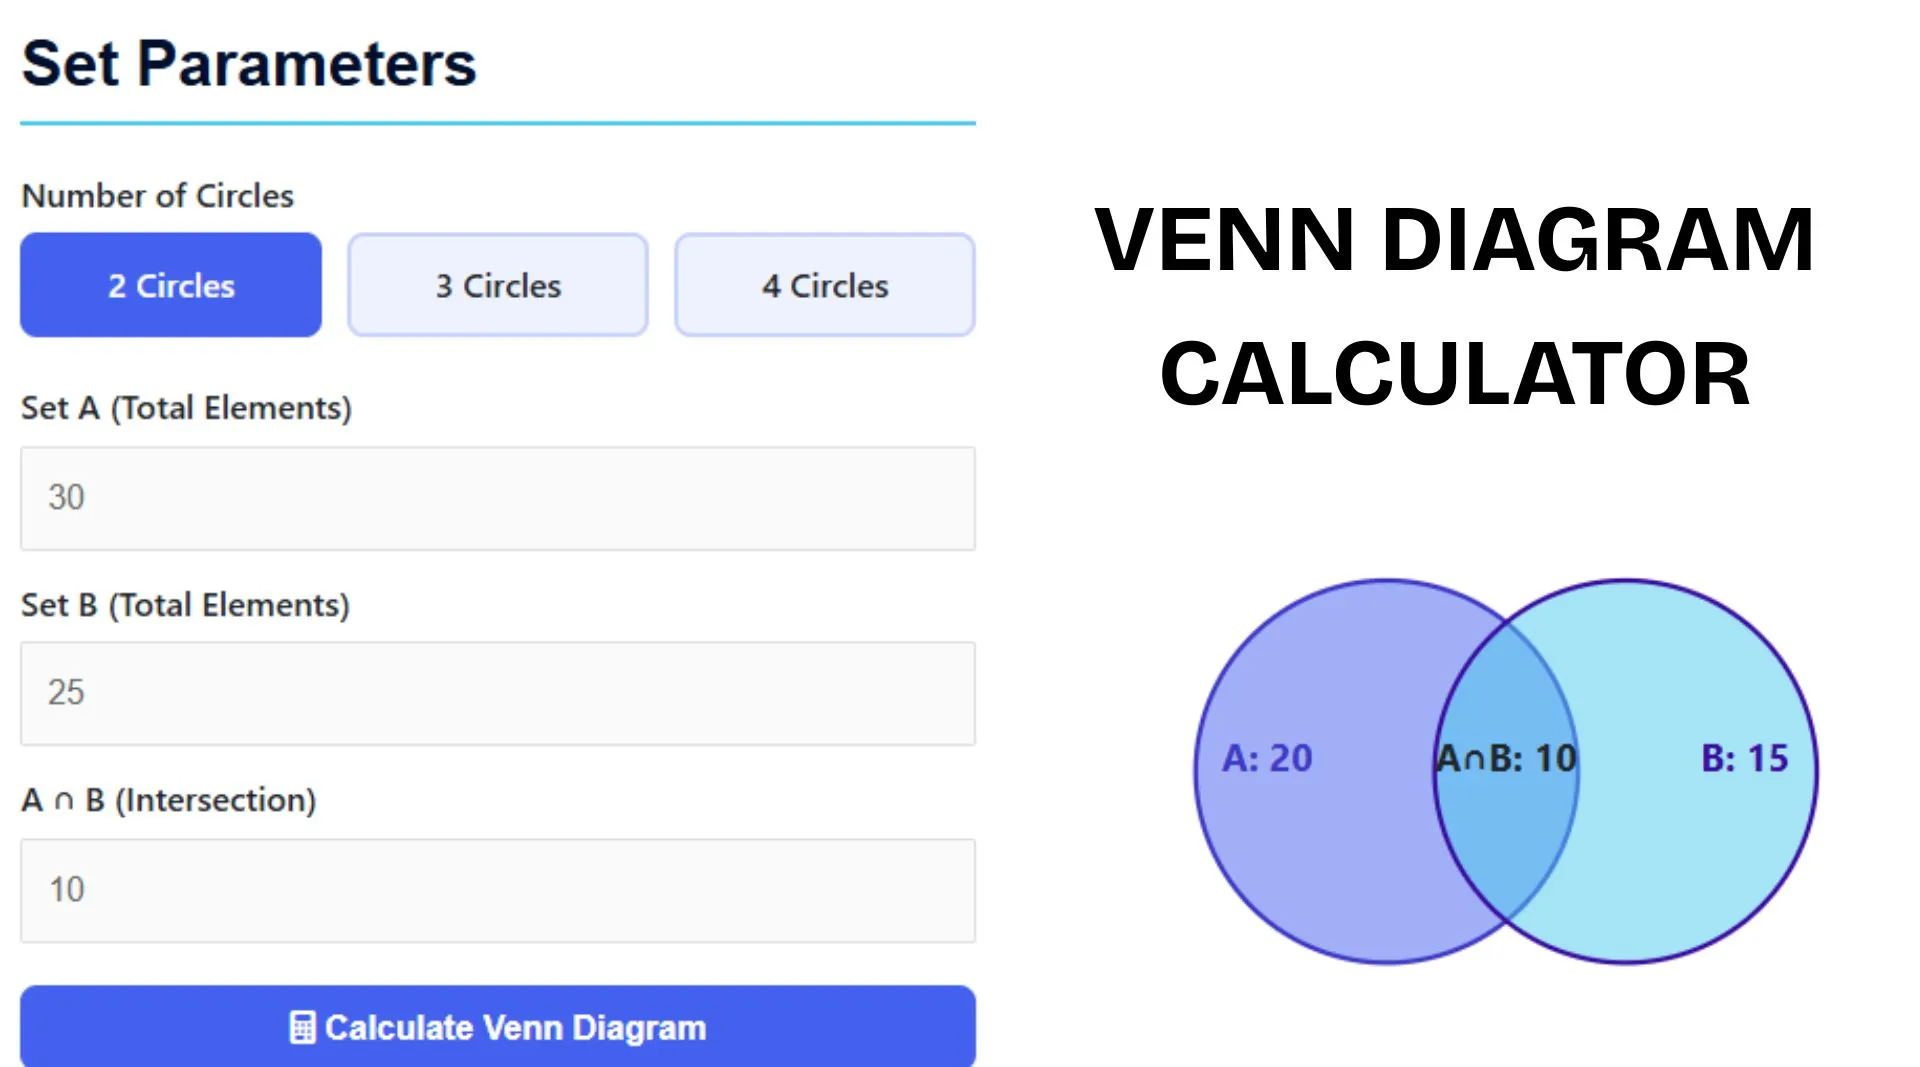
Set Parameters
About the Venn Diagram Calculator
This interactive Venn Diagram Calculator helps you visualize relationships between different sets. With support for 2, 3, or 4 circles, it’s perfect for students, teachers, and professionals working with set theory, probability, or logic.
Venn diagrams are essential tools in mathematics, statistics, computer science, and business analytics. They help illustrate logical relationships between different groups of items, making complex data more comprehensible.
Our calculator automatically computes all regions of your Venn diagram in real-time, showing not only the visual representation but also calculating key values such as unions, intersections, and set differences.
How To Use This Calculator
Step 1: Select Number of Circles
Choose whether you want to work with 2, 3, or 4 sets using the circle buttons.
Step 2: Enter Set Values
Input the total elements in each set. For multiple sets, provide the intersection values where sets overlap.
Step 3: View Results
Click “Calculate Venn Diagram” to see the visual representation and detailed calculations. The diagram shows all regions with their counts, and the results section displays key calculations.
Step 4: Adjust and Explore
Modify any input value and see the diagram update in real-time. This is useful for exploring “what-if” scenarios in set relationships.
FAQs
A Venn diagram is a visual representation of mathematical or logical sets using overlapping circles. Each circle represents a set, with overlapping regions showing common elements between sets.
The “only in A” value is calculated as: Total in Set A minus the intersection of A with all other sets. For two sets: Only A = A – (A ∩ B).
Yes! Venn diagrams are excellent for visualizing probability relationships. Enter your event sizes as set values, and the calculator will show the relationships between events.
A ∪ B (read as “A union B”) represents all elements that are in set A, or set B, or in both. It’s the combination of all elements from both sets without duplication.
The universal set is represented by the space surrounding all circles. Elements not in any set are shown in this space and labeled as “Neither”.
Related Educational Tools
Check out these other helpful calculators for your educational needs:
Created by Sadiq Saleem | Reviewed by Team TheEducationistHub